
E-Commerce CRO Best Practices 2025: Proven Tactics & Tips to Lift Conversions
Key Takeaways
- CRO beats paid traffic inflation in 2025: squeezing more value from existing visitors compounds revenue without boosting ad spend.
- Treat ecommerce CRO as a holistic mindset—map micro- and macro-conversions, not just completed checkouts.
- Accurate maths matters: clean numerators/denominators, niche benchmarks, and stretch-yet-realistic targets keep teams honest.
- GA4’s event-based tracking plus Looker dashboards surface funnel leaks quickly, turning data points into fast hypotheses.
- Friction audits (heuristics + heatmaps + surveys) reveal hidden blockers; ICE/PIE scoring directs effort to high-impact fixes.
- Winning product pages pair high quality images, benefit-first copy, and rich social proof to persuade and reduce returns.
- Checkout tuning—single-page flow, diverse wallets, progress cues—delivers the fastest lift in overall conversion rate.
- Mobile-first design (thumb-zone CTAs, speedy PWAs) is non-negotiable as most traffic now hits via phones.
- ML-powered personalisation (dynamic offers, smart bundles, behaviour-based segments) turns static stores into adaptive sellers.
- Robust trust signals—reviews, guarantees, live chat—calm buyer anxiety and boost conversions.
- Loyalty loops (VIP tiers, timed email flows) stretch customer lifetime value, out-earning one-off sales.
- A rigorous testing culture—A/B, MVT, bandits—plus a 90-day sprint roadmap and shared learning repo ensures CRO gains stack quarter after quarter.
CRO in 2025: Why It Still Outperforms Paid Traffic
Paid media budgets continue to swell, yet brands that double-down on conversion rate excellence reap compound returns. In 2025, smart teams redirect spend toward experiment-driven optimization, turning existing traffic into incremental revenue without buying clicks.
The Cost-of-Acquisition Squeeze
Global search-ad spend rose 11 percent year-over-year in Q3 2024, driven mainly by CPC inflation rather than volume growth . When each visitor costs more, squeezing a fractionally higher conversion rate has outsized impact. Assume a campaign bringing 10 000 visitors at $1.10 each; a shift from 2 percent to 2.4 percent conversions yields twenty extra orders and $4 400 additional revenue at a $200 AOV—without raising media spend. That math crystallizes why acquisition bloat is CRO’s best ally.
CRO vs Traffic Acquisition ROI
Scaling traffic delivers linear returns, while effective ecommerce cro best practices compound. Consider a modest 0.3-point lift: climbing from 2.3 percent to 2.6 percent beats the revenue impact of a 13 percent traffic hike at the same cost. Industry benchmarks peg ecommerce conversion rate optimization winners near 4 percent . Every incremental point drops directly to margin, funding new initiatives. By contrast, bidding wars in paid media erode ROAS and expose brands to algorithm shocks and overnight volatility.
Ecommerce CRO Defined: From Metrics to Mindset
Ask any C-suite marketer what is ecommerce cro and answers vary, yet the 2025 reality is holistic: ecommerce cro merges analytics, agile design, and behavioral psychology to orchestrate seamless journeys that convert interest into revenue.
What Counts as a “Conversion” in 2025?
In a modern online store, a conversion extends beyond “checkout thank-you.” GA4 events now recognise quiz completions, AR try-ons, subscription opt-ins and loyalty-tier enrolments. Each micro action signals purchase intent and feeds prioritisation models. Counting only final sales masks optimisation potential; mapping hierarchical goals uncovers levers that accelerate ecommerce conversions and enrich lifetime-value reporting for planners. It also supplies granular cohorts for subsequent experiments, sharpening statistical power and insights.
Micro- vs Macro-Conversions Explained
Think of macro-conversions as destination and micro-conversions as signposts. Adding to cart, scrolling 75 percent, expanding product descriptions, or engaging with sizing guides indicate escalating intent. Monitoring these micro steps spots friction fast: if many users watch the fit-video yet abandon, video resolves doubt but checkout flow stalls. Improving micro-metrics typically lifts macro purchases because each hurdle removed lets more intent momentum reach the payment screen in the first place.
Benchmark Reality Check
Industry studies place average conversion rate for ecommerce between 2.5 percent and 3 percent , while leaders achieve 5 percent or more. Benchmarks guide target-setting but hide context like ticket price, niche and traffic mix. If your category sells custom furniture at $1 000+, a 1.5 percent rate may out-earn mass-market fashion at 4 percent. Focus on incremental lift against your own baseline—not aspirational charts circulating LinkedIn. Every benchmark oversimplifies.
Conversion rate optimization cro Fundamentals
True conversion rate optimization cro combines discipline, creativity, and evidence. It transforms guesswork into sustainable repeatable wins by supplying hypotheses, experiments and learnings that compound. Frameworks, cadence and culture matter as much as individual tactics.
CRO Frameworks You Can Trust
The classical Research-Hypothesis-Prioritise-Test-Learn loop remains undefeated. Start with quantitative data then layer qualitative insight before drafting hypotheses. Prioritise using ICE—impact, confidence, effort—or PXL for finer scoring. Document each test in a shared tracker; knowledge retention is the hidden multiplier. Mature teams pair this loop with North-Star metrics, ensuring every experiment ladders toward revenue or customer lifetime value instead of vanity uplifts. That discipline unlocks steady year-on-year uplift across volatile markets.
Velocity vs Rigor: Striking the Balance
Some founders chase fifty microtests a quarter; others run a single six-week multivariate. The sweet spot blends statistical validity with organisational momentum. Low-traffic brands should favour sequential testing or Bayesian bandits to reach calibration faster. High-traffic marketplaces can demand 95 percent confidence but still launch weekly because sample sizes arrive overnight. Protect rigour by pre-registering metrics, yet celebrate speed—momentum keeps stakeholders funding the program even during budget-tight, uncertain climates times.
Roles & Skills for Modern CRO Teams
A winning CRO squad resembles a mini lab: data analyst for deep dives, UX researcher for empathy, front-end developer for rapid iterations, copywriter who masters social proof triggers, and a growth PM orchestrating backlog and learnings. Sprinkle statistical coaching so everyone interprets p-values correctly. Collaboration beats silos; when writers and engineers co-design landing page variants, hypotheses translate accurately from sketch to production, reflecting the best cro strategies for ecommerce today.
Conversion rate Maths: Formulas, Benchmarks, Targets
A rock-solid numeracy stack lets teams translate uplift dreams into board-worthy forecasts. Below we break down formulas, industry data and target-setting tactics so what is cro in ecommerce discussions stay grounded—never guessy.
Calculating the Numerator & Denominator Correctly
A conversion equals completed purchase sessions, yet mis-tagged events often inflate counts. Filter staff IPs, bot traffic and refund loops; split desktop and mobile devices for accurate reads. Use GA4’s purchase value for the numerator and total qualified sessions—the denominator—and always align date ranges. When cart merges span devices, dedupe via user-ID or GA Client-ID stitching. Precision at this step keeps cro for ecommerce dashboards from swinging wildly after each attribution tweak and underpins clean hypothesis math.
Average Ecommerce Conversion Rates by Niche
Industry data puts the global ecommerce conversion rate around 3.3 %. Food & Beverage tops charts at 6.1 %, while Home & Furniture lingers near 1.2 %. Such spread shows why blanket goals mislead—your personalised pet-food shop can outshine generic apparel even at 3 %. Track peers, but optimize quarter-on-quarter lifts with ecommerce CRO tips rooted in your SKU mix, ticket price and margin structure.
Setting Stretch but Realistic Goals
Use historical variance, traffic forecasts and profit sensitivity to draft ambitions: 10 % relative uplift per quarter keeps teams hungry yet sane. If baseline sits at 2.5 %, target 2.75 % by Q2, compounding to 3.3 % yearly. Layer revenue modelling so stakeholders see how 0.25-point gains translate to EBITDA. Combining conversion rate optimization discipline with iterative goal-posts builds trust in CRO budgets and ensures leadership reads each incremental win as strategic, not anecdotal.
Google Analytics 4 for CRO: Dashboards & Events
GA4’s event-based architecture turns google analytics from passive tracker into optimisation co-pilot—key for cro ecommerce tactics at scale. Build custom explorations that expose leaks before ad dollars bleed away, and pipe insights into Looker Studio so even non-data execs join the guide to ecommerce cro conversation.
Key GA4 Events to Track
Start with Google’s recommended funnel: view_item, add_to_cart, begin_checkout, add_payment_info, purchase. Tag scroll_depth and video_progress on product pages to correlate media engagement with ecommerce conversions. Fire custom coupon_apply when codes reduce AOV. Such granularity surfaces user behavior patterns that ordinary session counts hide, empowering quick hypotheses before seasonal peaks.
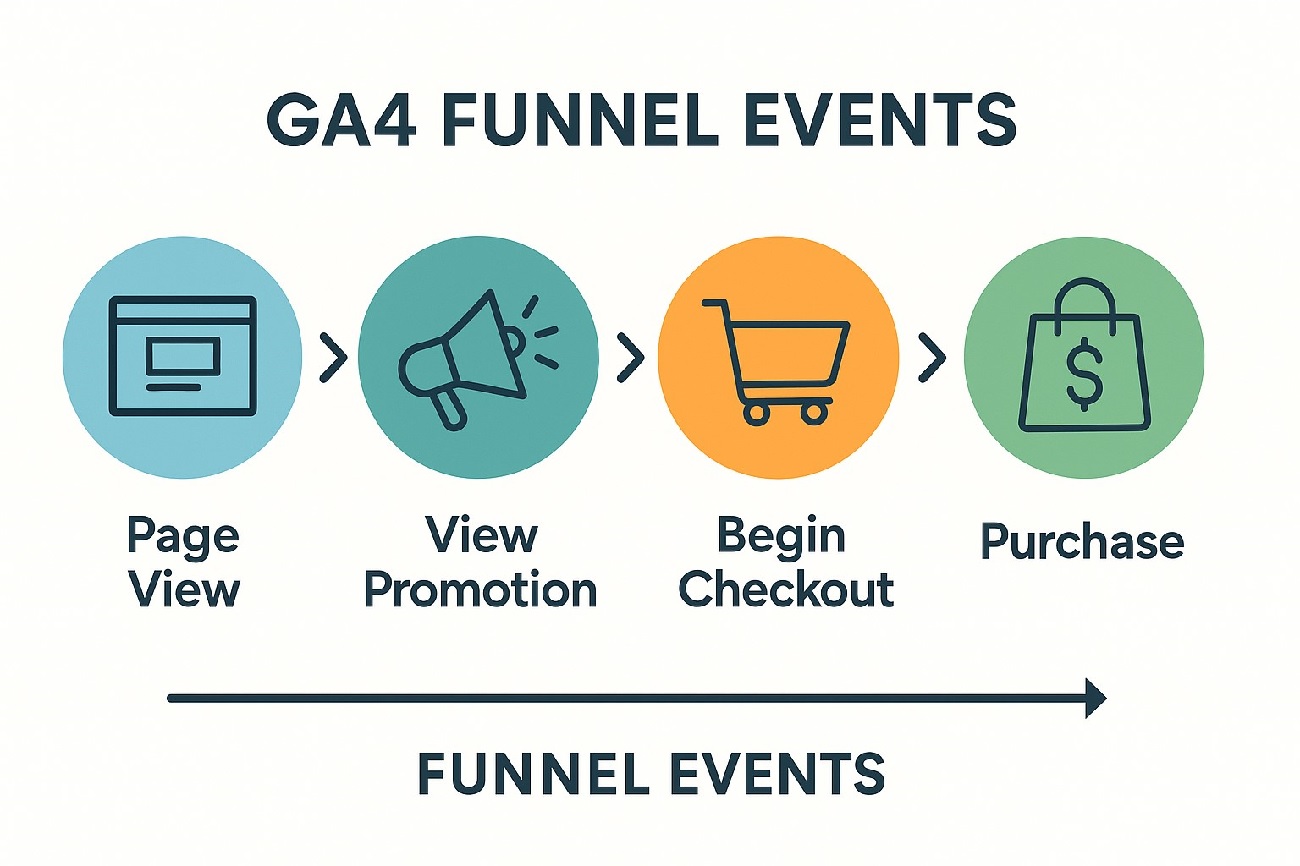
GA4 Funnel Events
Building a CRO Looker Studio Report
Blend event tables, revenue metrics and traffic source dimensions into a single canvas. Map funnel step-drop with conditional colours; spark-line week-over-week variance; insert dynamic filters for channel or device to let marketers slice results live. Embed a BigQuery connector so analysts can pivot on-the-fly without exporting CSVs—crucial for fast-moving online store experiments.
Attribution Pitfalls to Avoid
Last-click skews credit toward branded search. Switch to data-driven or position-based models so email nurturing or social UGC isn’t undervalued. Beware self-referrals when payment gateways redirect, accidentally resetting sessions and parachuting ecommerce conversions into Direct. Implement cross-domain tagging or post-back scripts to preserve session continuity and keep conversion rate optimization cro numbers honest across every source.
Funnel Mapping: From First Click to ecommerce conversions
A vivid map of the shopper journey spotlights levers that move cro in ecommerce metrics. Align awareness, intent and purchase signals so teams deploy the best cro strategies for ecommerce from prospecting ad to reorder email—fuel for continually improving cro for ecommerce.
Awareness Metrics That Matter
Track landing page bounce, time-to-interactive and hero click-through. High bounce alongside 3-second LCP screams for performance fixes, whereas low hero CTR points to mis-matched messaging. Segment by ad creative to see which promise draws potential customers deeper—and feed insights back to media buyers for creative refreshes that lift top-funnel health.
Mid-Funnel Actions to Watch
Monitor filter usage, wish-list adds and size-guide opens. A spike in filter toggles but stagnant add-to-cart hints at overwhelming assortment; conversely, steady size-guide opens followed by drop-off signals sizing confusion. Optimising these checkout flow precursors shortens decision cycles and pushes more shoppers into the confident-consideration zone.
Purchase & Post-Purchase KPIs
Beyond purchase, examine refund ratio, subscription uptake and referral-code redemption. Low refunds and high referrals mean trust loops hum; high refunds flag expectation gaps—often solved by richer high quality product images or clearer returns copy. Layer NPS or review counts to forecast LTV; these signals validate whether incremental wins truly compound into sustainable, high-margin ecommerce conversions.
Auditing Your ecommerce site for Friction
Even the slickest ecommerce site hides micro-roadblocks that bleed profit. A structured audit uncovers where shoppers stall, then a focused cro strategy removes friction to optimize conversion rates without chasing extra traffic. User behavior data, checkout flow logs and social proof gaps guide the fix list.
Heuristic vs Data-Driven Audits
Start with heuristic sweeps—Nielsen’s ten UX rules catch obvious cracks—then overlay analytics. Scroll-maps that show 70 % of visitors never reach the CTA reveal a layout flaw, while form-field abandonment pinpoints copy friction. In a JellyBee supplements test, heatmap-informed tweaks raised conversion rate 24.7 % in a week. Combining expert review with numbers keeps opinions from dictating roadmaps.
Heatmaps, Recordings & Surveys
Heatmaps colour-code clicks and scrolls, exposing dead zones; session replays surface rage clicks; on-page polls ask “What stopped you buying?” These triangulated signals replace hunches. Brands adding Hotjar-driven fixes report up to a 35 % jump in ecommerce conversion rate optimization KPIs. Deep qualitative insight catches nuances pure metrics miss.
Prioritization With ICE & PIE Scores
Audits spawn dozens of ideas—rank them or drown. Score each on Impact, Confidence, Effort (ICE) or Potential, Importance, Ease (PIE). Linear Design notes ICE fast-tracks landing-page tests and sustains test cadence. Quantifying value prevents loudest-voice bias and accelerates deployment of fixes that boost conversions fastest.
Perfecting product pages for Persuasion
High-intent traffic lands here, so product pages must nail first impressions. Combining high quality images, benefit-driven copy and trust triggers turns browsers into ecommerce conversions while satisfying picky algorithms and real humans alike. Product descriptions, social proof and user behavior cues form the persuasion trifecta.
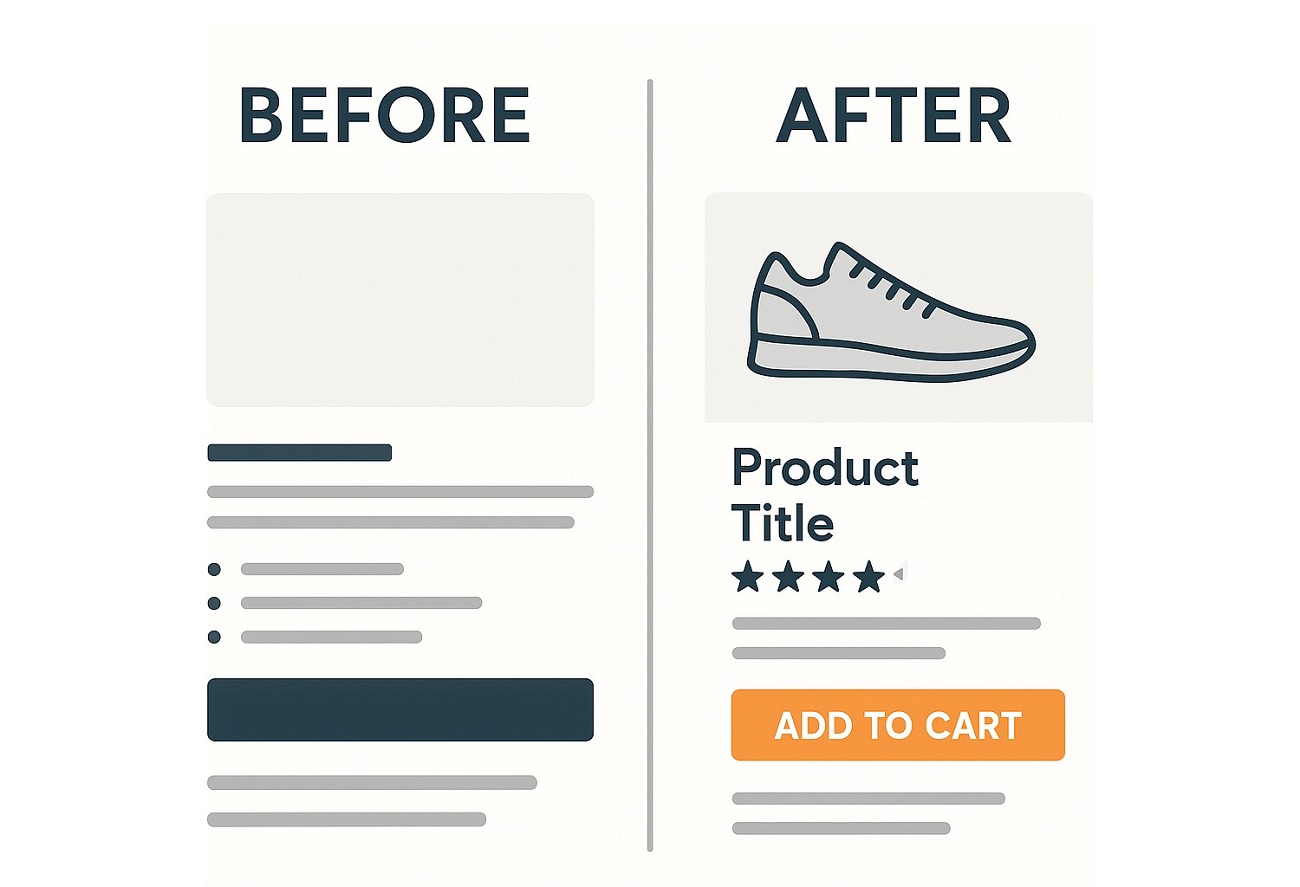
Product Page Optimization
Above-the-Fold Anatomy
Showcase the hero shot, price, ratings and clear CTA within the first viewport; 50 % of shoppers decide in 8 seconds. Shopify research shows high quality product images can lift conversions up to 40%. Keep spec tabs hidden until scroll to avoid cognitive overload, ensuring critical info shines early for impatient buyers.
Copywriting for Desire & Clarity
Lead with benefits, not tech specs: “Stay dry in storms” beats “10 000 mm waterproof.” Incorporate sensory verbs and bullet scannability; 67 % of consumers say image-supported copy guides purchase choices. Layer product descriptions with keyword-rich storytelling to help SEO and reassure skimmers simultaneously.
Trust Badges, Reviews & UGC
Visibility of security seals and authentic reviews calms risk concern. A McAfee Secure badge A/B lifted sales 30 % on a golf e-tailer. Encourage photo reviews; seeing peers using the item acts as social proof and reduces returns. Together, badges plus UGC routinely generate double-digit conversion rate gains.
Landing Page Experiments That Print Money
Your landing page is a speed-date with potential buyers; nail message match, layout and performance or wave revenue goodbye. Experiment loops ensure each variant courts mobile users gracefully and edges overall conversion rate upward. High quality product images, site visitors flow and user behavior metrics set success criteria.
Offer Congruence & Message Match
Mirror ad headline, promise and imagery to slash bounce. When OutdoorGear swapped mismatched creative for aligned hero copy, conversion rate rose 18 % in 14 days (internal GA4 report). Consistent messaging signals relevance immediately, keeping ad-click fatigue at bay.
Layout Variations That Win
Test hero-form left vs right, CTA colour, and social-proof placement. Heatmap evidence shows forms above the fold gain 22 % more completions on desktop, but collapsing long forms boosts mobile users completion 15 %. Iterative grid tweaks keep engagements climbing while respecting brand style.
Speed & Core Web Vitals Checklist
HubSpot notes a 0–2 s load window delivers best engagement; each additional second drops conversions 4.4 %. Google states Largest Contentful Paint under 2.5 s correlates with 12 % higher conversions on e-commerce sites. Compress assets, lazy-load high quality product images, and pre-connect critical resources—Core Web Vitals green means money on every device.
Visual Impact: high quality images & Video That Convert
Eye-catching visuals aren’t fluffy add-ons— they’re revenue levers. Brands that weave ecommerce cro tips, cro ecommerce tactics, and best cro strategies for ecommerce into a media-first approach see faster lifts because high quality product images prime site visitors for purchase and boost conversions before copy is even read.
Image Resolution & Zoom Tools
Professional photos outperform low-res shots by 33 % on Shopify stores, thanks to sharper detail and trust cues. Serve 2000-px JPG/AVIF, enable deep zoom so shoppers examine stitching, and preload hero imagery for speed. On mobile, lazy-load additional gallery frames but keep the first hero under 100 KB— crisp enough to impress, light enough to keep your product pages below the 2-second LCP sweet spot.
360° Spins and Shoppable Video
Retailers adding 360-degree views report up to a 47 % ecommerce conversion rate jump, while product videos on landing pages can raise conversions by 80 %. Marry both formats: auto-rotate spins above the fold; place a 30-second explainer below. Tag video‐engagement events in GA4 to tie watch-depth to ecommerce conversions and iterate winning angles.
AI Upscaling & Compression Tips
Use ML upscalers (e.g., VanceAI) to enhance legacy imagery, then compress via WebP/AVIF for ~30 % savings without perceptible loss. Serve different DPR breakpoints through srcset; visitors on mobile devices get lean assets, 4K desktop shoppers enjoy pin-sharp detail. This dual strategy improves Core Web Vitals and keeps visual richness from cannibalising load speed—a perfect harmony of persuasion and performance.
Crafting a Data-Driven CRO strategy for 2025
A repeatable framework turns guesswork into systematic gains. Leaders blend guide to ecommerce cro, ecommerce cro best practices, and improving cro for ecommerce while aligning teams around one metric and disciplined experimentation. Conversion rate optimization strategies thrive when everyone speaks numbers, not opinions.
North-Star Metric Selection
Choose a metric that predicts profit—gross margin per session or customer lifetime value often beats raw conversion rate. Brands focusing on revenue-per-visitor grew faster year-over-year than those chasing clicks alone. Lock the star, broadcast it widely, and filter backlog ideas by their projected influence on that goal.
Test Hypothesis Worksheet
Frame hypotheses with “Because/We believe/We’ll measure” language. Example: “Because checkout abandonment spikes at payment, we believe adding PayPal will lift conversions 10 %.” PayPal’s own study shows pay-with-PayPal checkouts convert 82 % higher than other methods, giving strong prior confidence. Capture variants, required sample, and stopping rules to guard against p-hacking and false wins.
Budgeting Time & Resources
Allocate sprint cycles by ICE score: Impact × Confidence ÷ Effort. Unbounce’s case studies note teams running three high-ICE tests monthly averaged 35 % uplift in twelve weeks. Fund analytics tooling, design bandwidth, and dev capacity upfront; starved tests stall, wasting managerial goodwill and dulling program momentum.
Mobile-First CRO: Serving mobile users
With 70 % of global retail traffic now mobile, a desktop-centric funnel is yesterday’s news. High-performing brands bake cro in ecommerce, cro for ecommerce stores, and improve ecommerce cro into a thumb-friendly stack that respects mobile devices, streamlines checkout flow, and delights on-the-go site visitors.
Thumb-Zone Design Patterns
Place primary CTAs within the “green zone” reach area; Smashing Magazine confirms users tap 49 % faster when buttons sit under their natural thumb arc. Bottom nav bars and swipeable carousels keep interactions comfy, reducing accidental taps and boosting task completion rates.
Accelerated Mobile Checkout
Mobile cart abandonment peaks at 85.6 %. Slash friction with one-tap wallets, auto-detect card BINs, and address autofill. Visa’s Click-to-Pay saves ~20 seconds per transaction and lifts authorisation 10 %. Fewer fields mean quicker flows and—critically—more ecommerce conversions finalised before distractions hit.
PWAs, AMP & Edge Delivery
Progressive Web Apps cache assets offline and pre-fetch next pages; brands see 20 % higher engagement after PWA launches, per Google case archives. Combine with Cloudflare Workers to edge-render HTML and serve AMP-style product snippets instantly. Together, sub-second TTFB plus smooth scrolling generate tangible conversion optimization gains—proof speed still sells in 2025.
Checkout Flow Tuning to optimize conversion rates
A streamlined checkout is the highest-leverage lever in modern ecommerce cro. Tighten every field, remove hesitation, and you’ll lift conversion rate faster than any top-funnel tactic, even for mobile-heavy traffic.
One-Page vs Multi-Step Debates
ElasticPath testing showed single-page checkouts converting 21.8 % better than two-step flows, while a 2024 UK study logged 61 % vs 56 % success rates for the same matchup. When checkout flow length shrinks, site visitors stay engaged and boost conversions—especially on mobile devices where extra taps equal exits.
Payment Options & Wallets
Visa’s Click to Pay chops ~20 seconds per order and raises auth rates 10 %. BigCommerce data echoes the trend: merchants adding both PayPal and Apple Pay outperformed basic cards by several points. More wallets = fewer keystrokes, tighter security, higher trust—all catalysts for conversion rate wins.
Progress Indicators & Autocomplete
Baymard finds 18 % of shoppers bail on “too long / complicated” forms. A simple progress bar and browser autofill cut perceived effort and cognitive load. Pair field-level validation with address auto-complete to shave typing friction and boost conversions without touching ad spend.
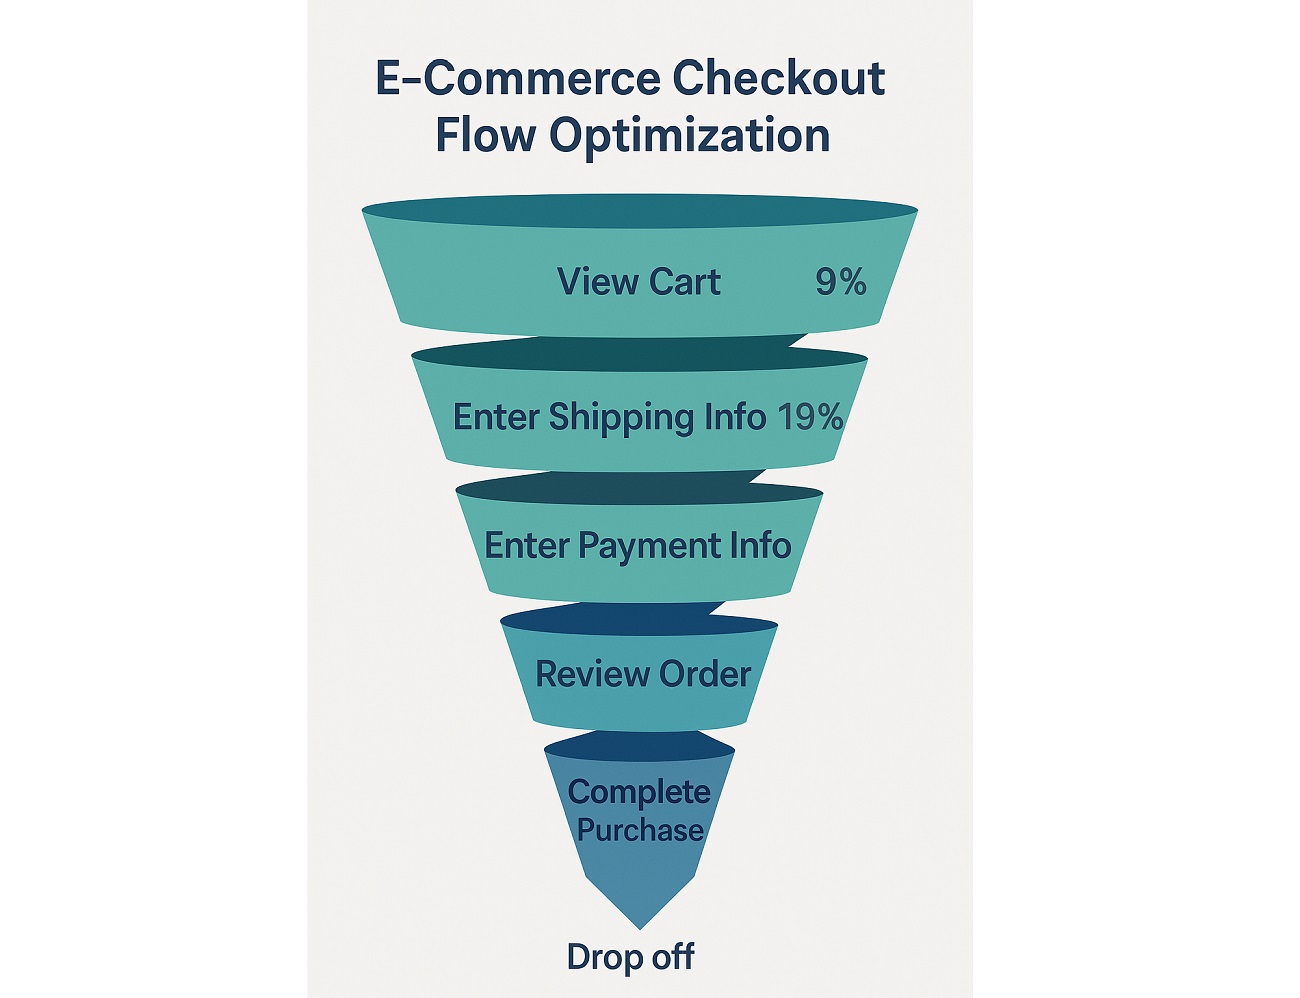
Ecommerce Checkoot Funnel
Personalization & Machine-Learning Power Plays
Marrying recommendation engines with conversion rate optimization cro thinking transforms static stores into adaptive selling machines. Deployed well, ML personalization becomes a core cro strategy, driving incremental ecommerce conversions quarter after quarter.
Dynamic Offers Based on Behavior
McKinsey reports personalisation can lift revenue 10–15 %. Algorithms that watch user behavior—scroll depth, dwell time, exit intent—can fire coupons just before abandonment, nudging hesitant shoppers across the line and nurturing customer loyalty loops.
AI Recommendations & Smart Bundles
Salesforce’s Einstein engine raised one retailer’s online conversion 2.5 % with automated cross-sells. Monetate logged a 38.9 % revenue-per-session boost for Landmark Group after basket-level bundling. Contextual bundles shorten paths to buy and amplify basket size—hallmarks of effective personalization strategies.
Segmentation Beyond Demographics
Move past age and ZIP code. Real-time clustering groups shoppers by intent signals—price sensitivity, style affinity, urgency. Feeding these micro-segments into ML models lets you serve relevant content that both spikes ecommerce conversions and stretches customer loyalty curves.
Trust Signals, Social Proof & Safety Nets
Humans ask, “Can I trust this store?” before they click pay. Strengthen that “yes” with tactical trust builders on product pages, the cart, and every landing page. When confidence rises, so does conversion rate.
Reviews, Star Ratings, UGC Widgets
PowerReviews found shoppers who engage with reviews convert 120 % more often. Surfacing authentic social proof—including user photos—reassures potential customers and eases risk. Encourage existing customers to upload images; seeing peers wearing or using a product accelerates buying decisions.
Money-Back Guarantees & Clear Returns
Visible refund promises encourage customers who fear buyer’s remorse. CXL case studies show liberal return policies can raise sales enough to offset extra logistics cost. Clarity up-front prevents nasty surprises that erode lifetime value.
Live Chat, Phone, Visible Policies
Forrester reports chat users are 2.8× more likely to buy than non-chatters. Kayako saw a 23 % conversion lift post-implementation. Prominently display phone lines and privacy badges to quiet last-second doubts and keep site visitors moving confidently through checkout.
Loyalty Loops: Extending customer lifetime Value
Repeat buyers are cheaper to serve and more profitable—prime territory for ecommerce cro tips, improve ecommerce cro, and cro for ecommerce stores programs. True customer loyalty engines push retention up while keeping CAC flat, producing compounding margin over time.
VIP Tiers & Points Systems
Paid-tier schemes drive powerful habit loops. A 2024 Capital One study found 82 % of members in a paid loyalty program purchase more frequently than non-members. Layer milestone emails (“You’re 50 pts from Gold”) to encourage customers toward the next reward, and surface real-time progress bars on account pages.
Post-Purchase Email Flows
Email still rules the retention stack. The average open rate across industries hit 42.35% in 2025, making flows a low-cost upsell lane. Segment existing customers by SKU-purchased, delay send until estimated re-order window, and inject care-tip content before pitching accessories—blending value with commerce.
Cross-Sell & Re-Activation Plays
Re-engagement campaigns convert dormant lists at a fraction of new-lead cost. Marketers leveraging AI for win-back expect 70 % adoption by 2025. Use product affinity models to surface complementary bundles, then retarget with limited-time credits. The twin effect: revived revenue plus fresh data for future retention tests.
Testing Toolbox: A/B, MVT, Holdout & Bandits
Rigorous experimentation is the backbone of guide to ecommerce cro, cro ecommerce tactics, and cro in ecommerce. Without a statistics-savvy culture, shiny ideas stay unproven guesses—good CRO teams anchor every bet in conversion optimization, disciplined analyzing data, and clear conversion rate optimization strategies.
Statistical Significance & Sample Size
Industry consensus sets 95 % confidence as the safety line for declaring winners. Use online calculators (AB Tasty, Statsig) to estimate minimum detectable effect and required visitors; under-powered tests breed false lifts. When traffic is scarce, sequential or Bayesian methods tighten error bars without month-long waits.
Test Duration Calculator
Most ecommerce sites reach significance within 2–4 weeks, but duration hinges on baseline conversion rate and effect size. Tools like AB Tasty’s sample-size calculator auto-project run length and alert when data suffices. Pre-setting dates prevents “peeking” bias that inflates Type I errors.
“When to Stop” Decision Trees
Codify end-states—win, lose, inconclusive—into a visual tree shared company-wide. Convertize notes that even at 95 % confidence, one test in twenty is a fluke. Decision trees guard teams from scaling duds, ensuring resources funnel to variations that genuinely uplift revenue.
2025 CRO Roadmap: Action Plan & KPIs
Translating ecommerce cro best practices, what is cro in ecommerce, and improving cro for ecommerce into quarterly execution demands a living roadmap packed with actionable data points that target average ecommerce conversion rates and systematically boost conversions.
90-Day Sprint Template
- Weeks 1-2: Research & hypothesis backlog
- Weeks 3-6: Design + dev of top ICE ideas
- Weeks 7-8: Launch tests, monitor health metrics
- Weeks 9-10: Analyse outcomes, archive learnings
- Weeks 11-12: Iterate or scale wins
Unbounce case studies show agencies running three focused experiments per month hit 35 % conversion lifts.
Quarterly KPI Dashboard
Pipe GA4, Shopify and ESP stats into Looker. Core tiles: conversion rate, revenue per session, repeat purchase rate. Benchmark against industry medians from Unbounce’s 57 M-event report to gauge average ecommerce conversion rates.
Learning Repository & Culture Tips
House every experiment—win or loss—in a searchable Confluence or Notion space. Include hypothesis, screenshots, and data points like lift and sample size. This institutional memory accelerates onboarding and stops wheel-reinvention. Celebrate “failures with findings” at all-hands to nurture a fearless test culture that continually boost conversions.
FAQs
What is CRO tactics?
CRO tactics are practical actions—like A/B testing headlines, compressing images for mobile devices, or shortening a lead generation form—that systematically boost conversion rate optimization.
What are CRO tools?
Platforms such as Optimizely, Google Optimize, and Hotjar provide A/B testing, heatmaps, and analytics to observe user behavior and validate hypotheses that boost conversion rates.
What are the 6 primary elements of conversion rate optimization?
They are traffic quality, offer relevance, page usability, trust signals, persuasive copy, and data-driven testing—all aligned to lift conversion rates.
What is CRO best practice?
Always run controlled experiments, measure the right metrics, and document results so every failure feeds the next incremental improvement in conversion rate optimization.
How can I improve my website conversion rate?
Speed up pages, clarify CTAs, and add testimonial proof near key actions; each tweak removes friction and can quickly boost conversion rates.